Debugging with VSCode's inbuilt Debugger

I am a Software developer with a love for OpenSource, Networking, Cloud and electronics. I work at Grace Health.
I am proficient as a Backend Engineer with the following Languages: NodeJS, Typescript, GoLang, Python. Cloud services: Heroku, AWS, Azure
Did this particular line of code run? Did this variable change? These are questions we ask ourselves while writing and testing code. Most of us usually print something out to the terminal (or any stdout). It can vary from "I'm here" to "count = 5". Debugging could be simpler though if you use tools whose only job is to debug a piece of code. Today, we're going to learn how to debug with the inbuilt debugger in VScode.
What do I stand to gain?
There are a lot of benefits that come from using the inbuilt debugger of VScode. Some of them are as follows.
- It is simple to use. If you ever printed to system out inside of a loop, you'd know how messy things get. You might never use a debugger to its fullest capability and that is okay. The beauty is not having to do a lot of work to get the reward of using a debugger.
- It is more flexible than a “console.log”. While printing out to the terminal is language agnostic, things can get messy for some use cases.
- It allows you to step through code in real-time. That is, you're able to see what's going on at every point of the code execution.
- It allows you to set breakpoints for local code and logpoints for code execution that you have no power to stop.
In a nutshell, the built-in debugger helps to speed up your code debug loop. So, how do we get started? It is very easy.
How to get started?
There is built-in debugging support for the Node.js runtime in VS Code. JavaScript, TypeScript, or any other language that gets transpiled to JavaScript is supported. For debugging other languages, one would have to install such language debugger extensions. We will focus on the built-in Node.js debugger for this article. Most of the concepts are applicable to other languages as well.
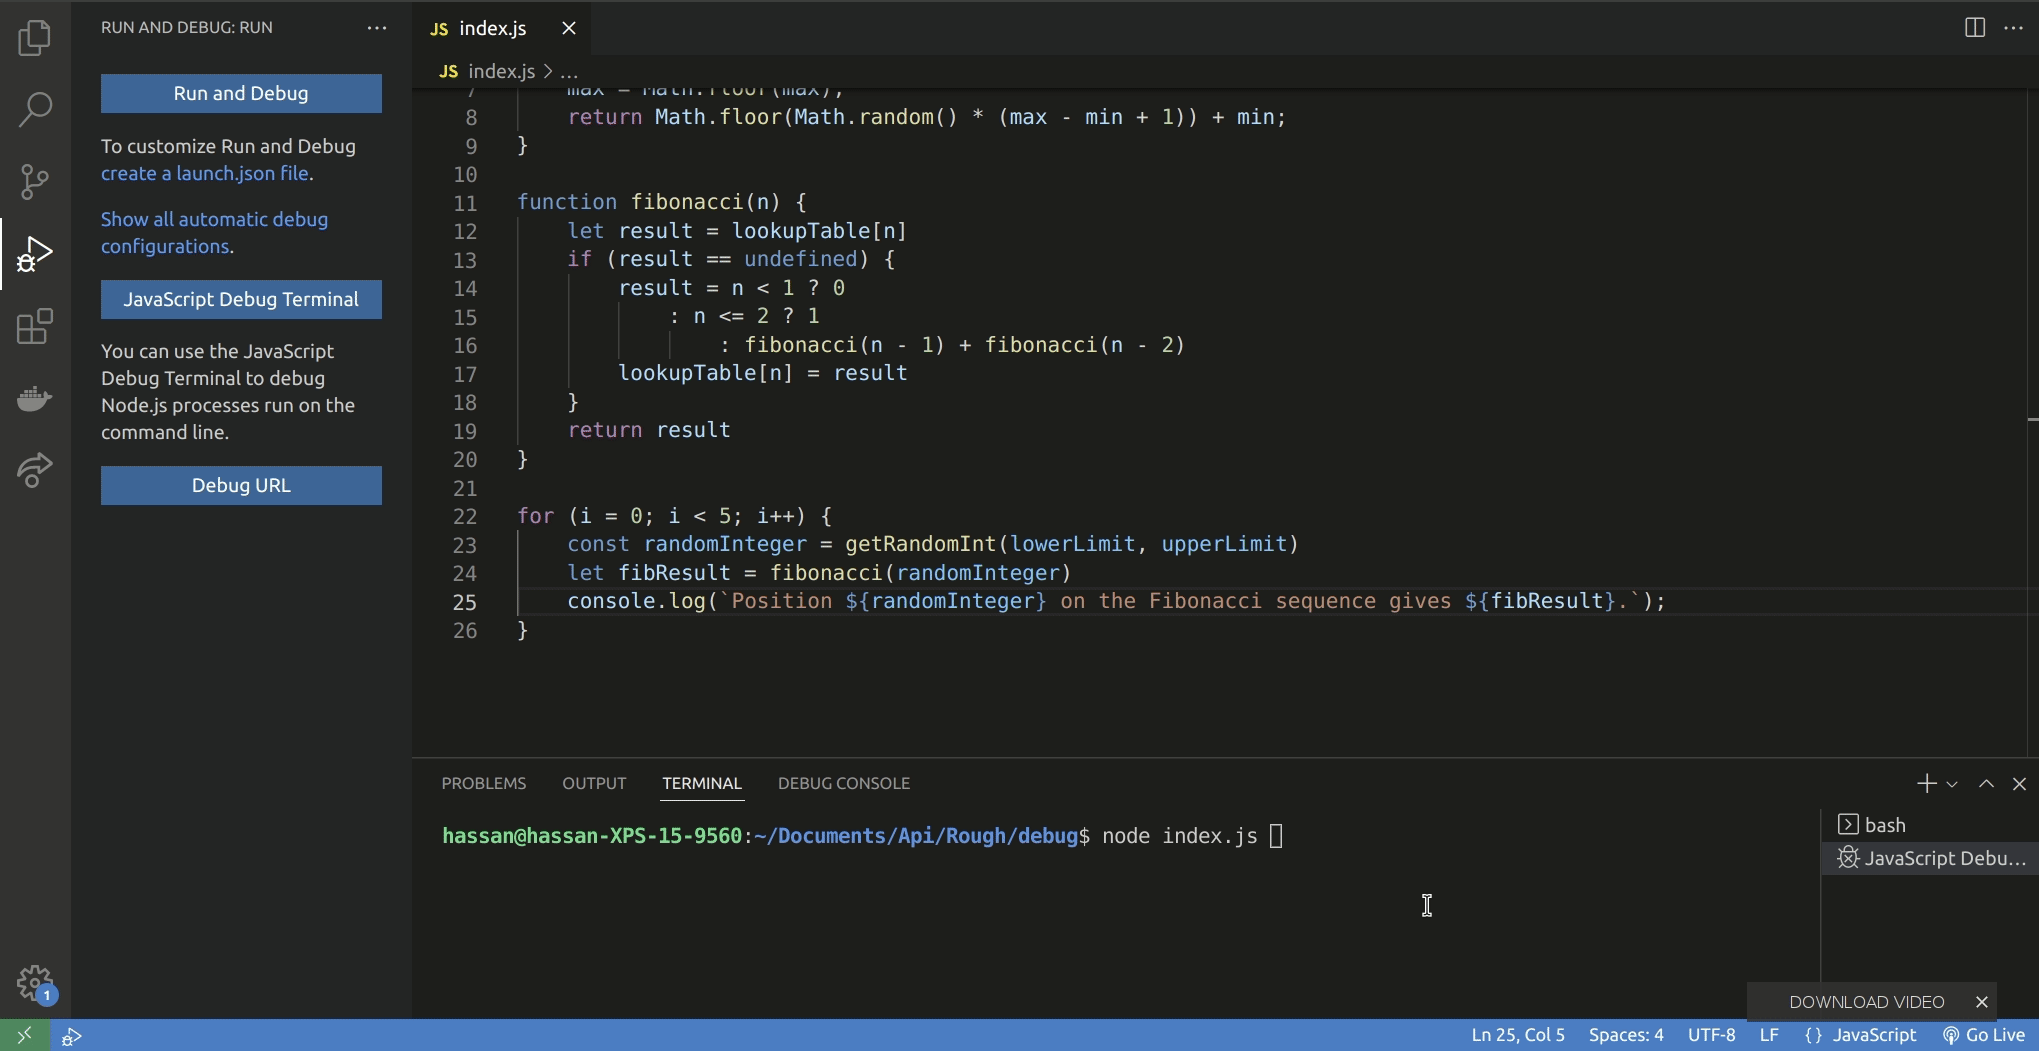
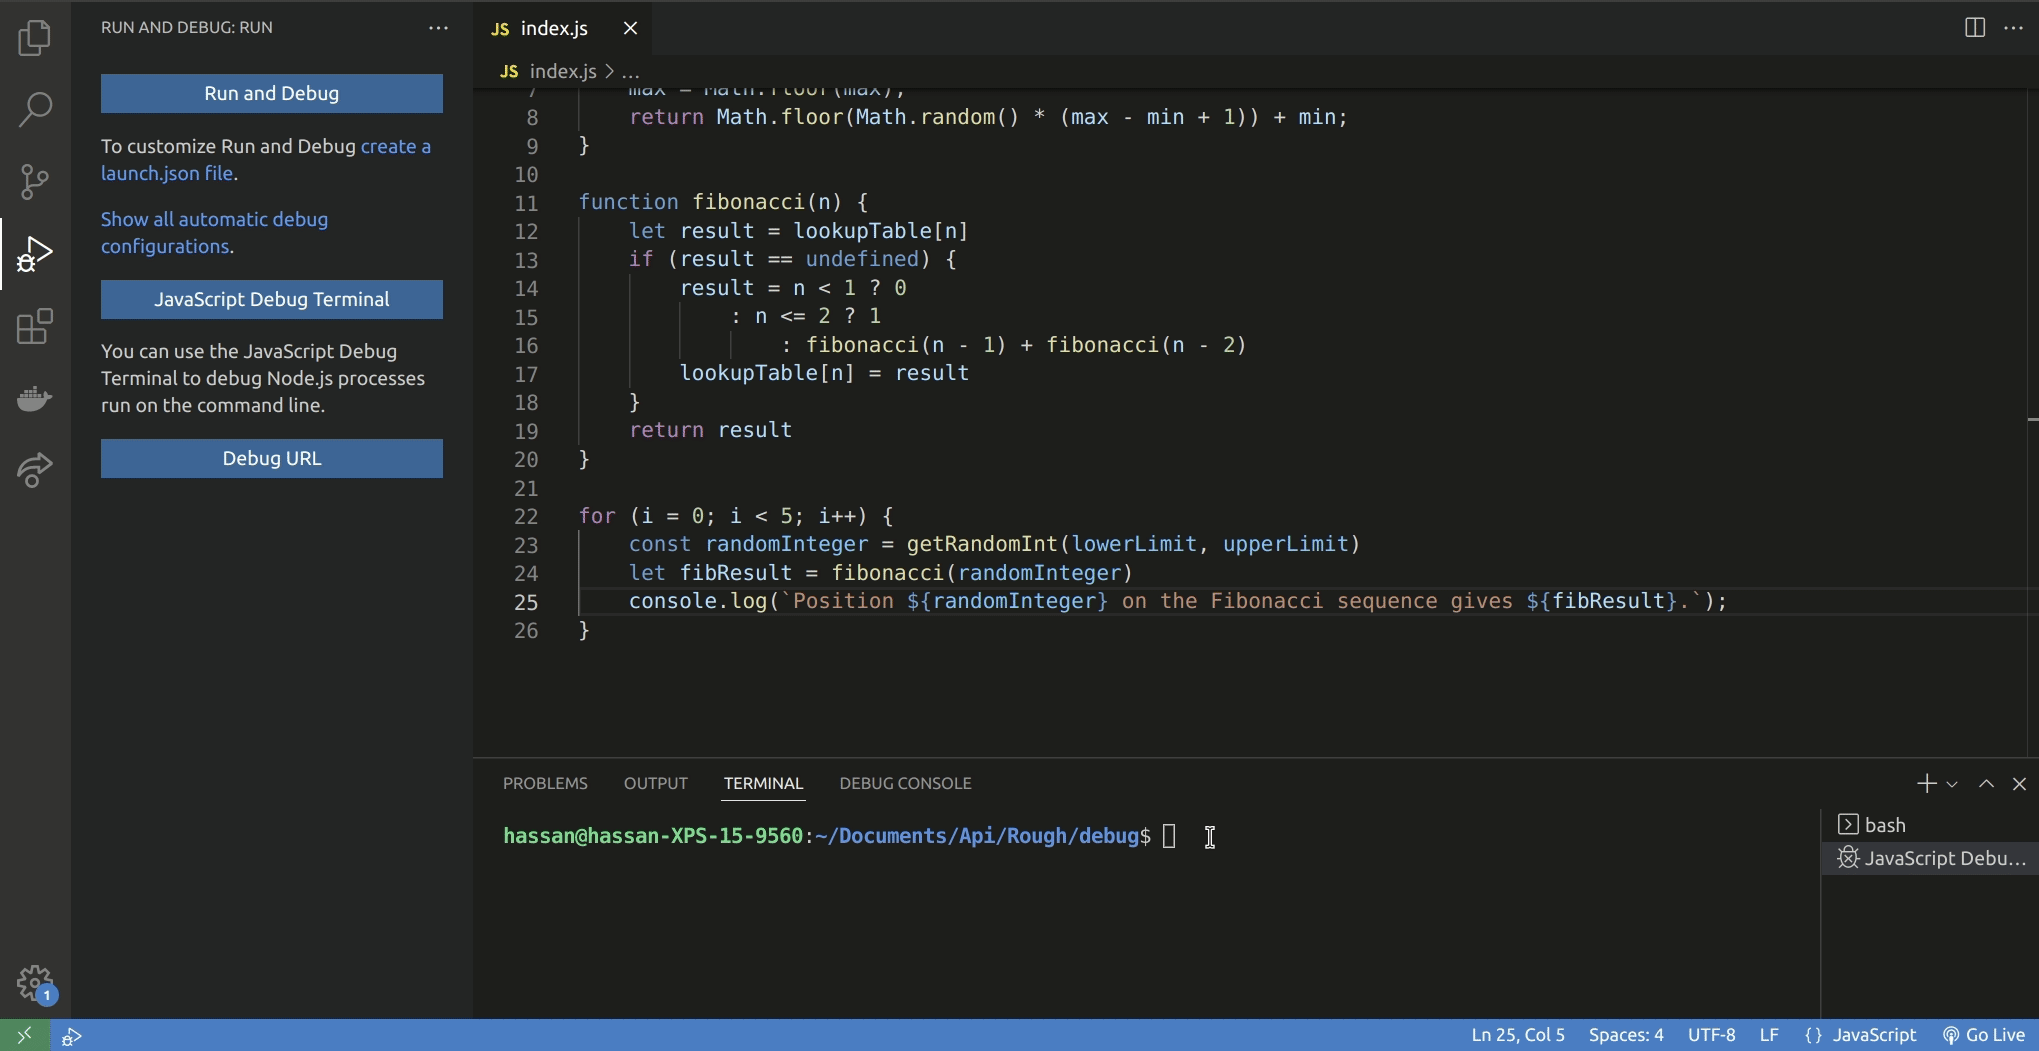
The easiest way to debug a JavaScript ( or Typescript) code is to use the JavaScript debug terminal. Any code initiated in that terminal gets connected to the inbuilt debugger. You would notice that the bottom bar of the VScode interface becomes orange. This indicates that the debugger is connected and in action.
Debug Actions and Flow Control
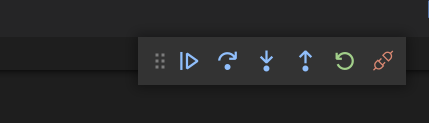
A bar of buttons floats around in the VSCode interface during debugging. The buttons on the floating bar are for directing the flow of your debugger’s code execution.
- Continue / Pause (
F5): This action allows to halt or resume the execution of code during debugging. Pressing this button at a breakpoint will resume code execution and stop at the next breakpoint (if it exists). Pressing this button during code execution will stop right where the system is executing at that time. - Step Over (
F10): This allows one to execute the next line of code. If the line contains a function the function will be executed and the result returned without debugging each line of the function. - Step Into (
F11): This action continues the execution of the next line of code. If the line contains a function, the debugger will enter the function and continue line-by-line debugging there. It behaves the same as “step over” but if it does not. - Step Out (
Shift+F11): This action returns to the line where the current function under execution was called. - Restart (
Ctrl+Shift+F5): This action starts the debugging process over again. - Stop (
Shift+F5): This action stops the debugger. The bar can be moved around at will into any position on the screen. Hovering on the button reveals the shortcuts which can make debugging faster when one gets familiar with them.
Breakpoints
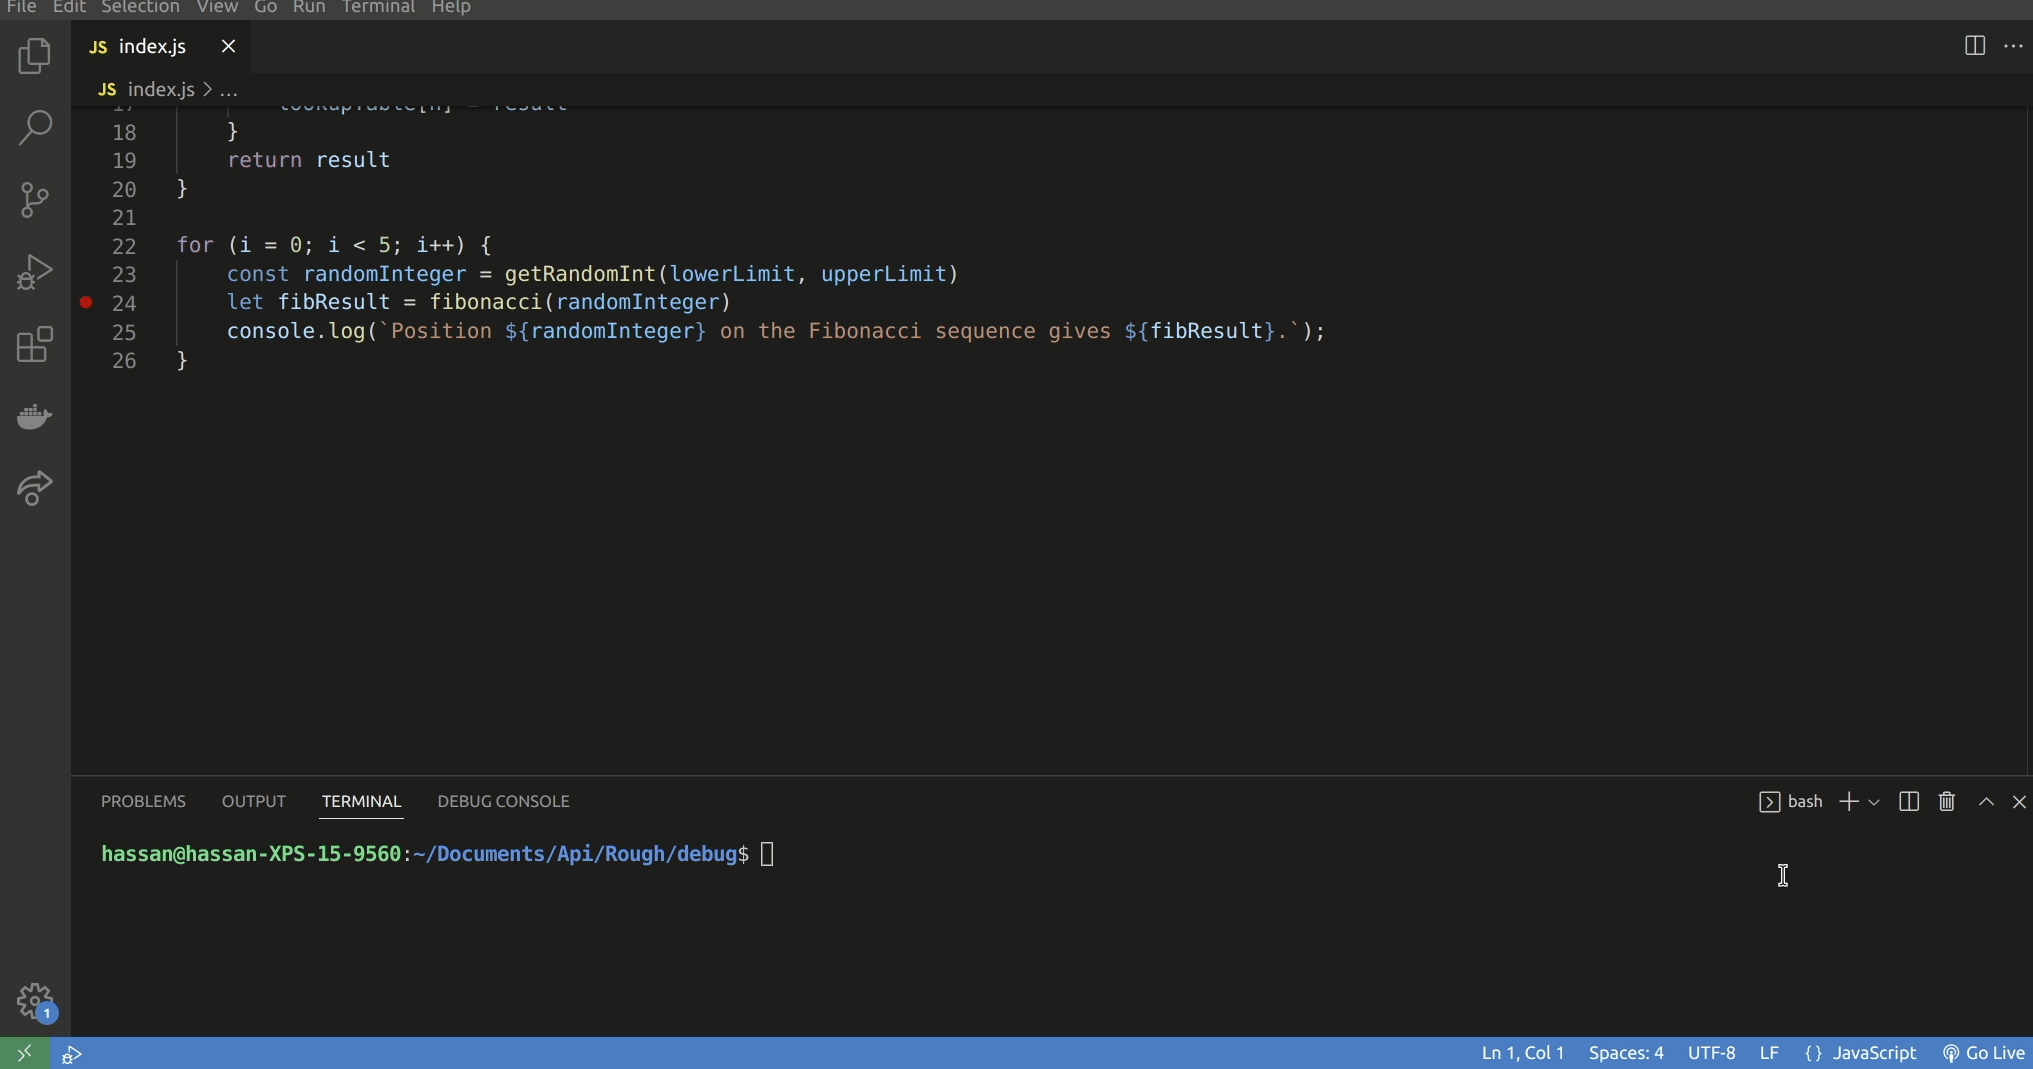
We need to let the debugger know when to stop during code execution. This is done by applying a breakpoint to that line of code. Breakpoints are toggled by clicking on the editor margin or using F9 on the current line.
Breakpoints in the editor margin are shown as red filled circles. These breakpoints can also be disabled for a particular debugging session without removing them. This is done in the BREAKPOINTS segment of the Run section of the sidebar. Disabled breakpoints are represented by a filled grey circle. When a debugging session starts, breakpoints that cannot be registered with the debugger change to a grey hollow circle.
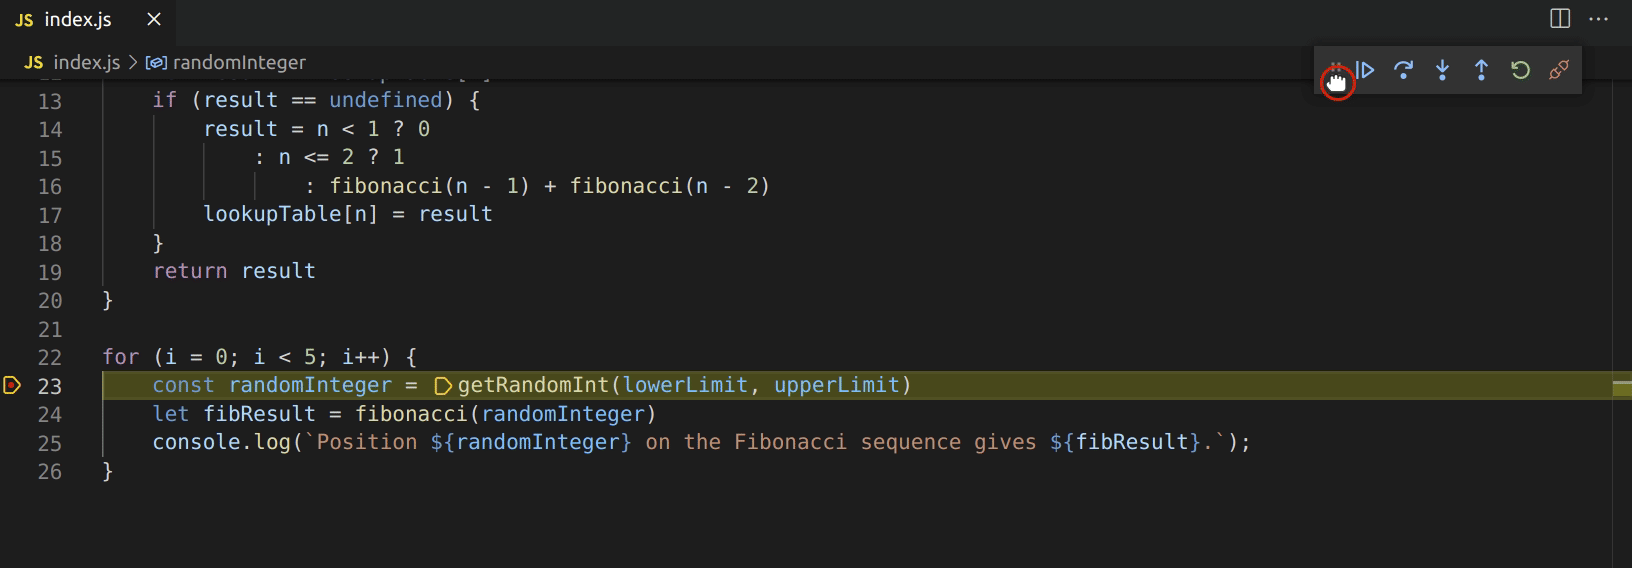
A running code with the debugger attached will always stop at an active breakpoint. This gives you the ability to explore the current state of the program with no stress. The gif below shows how one would set breakpoints and direct the flow of the code execution.
Data inspection and modification
There are many ways to inspect the current value of variables during a debugging session. The easiest way is to hover over the variable with the mouse cursor. This shows the current value of the variable at that point. Variables can also be inspected in the VARIABLES section of the Run view and in the CALL STACK section. The VARIABLES section is easier to use as it shows block, local and global variables at that point in the code execution.
If there is a need to track a particular variable, one can add it to the WATCH section of the debugger. Here, the value is displayed at all breakpoints and one doesn't have to look for it inside of the VARIABLES Section. The values of the variables can be modified and copied if needed in any of these sections.
One has to take note of several things at this point. The debugger won't show you the value of variables that are not in the code's current scope. Also, the debugger stops the execution at a breakpoint before it executes that line of code. This means that if one is assigning a value to a variable, stopping at that line isn't the right thing to do. The variable will hold its previous value before the assignment.
Debug in another language
It is possible to debug code written in another language other than Javascript. It would need several things to get started. They may include but are not limited to the following.
- Installing official support for that language in VSCode
- Installing other dependencies that make debugging possible for that language.
- Setting up a configuration file for the debugger configuration. A good place to start is to look for Debuggers extensions in the VS Code Marketplace. After following these steps or more, the process of debugging is the same and the above instructions apply.
I hope you were able to get something out of this. To get more information, check out the following resources. Have fun finding those bugs. Good luck.


